Analytics and reports in Investment Dominator 2.0 allow you to monitor and understand the performance of your deal flows, marketing campaigns, property listings, and lead generation efforts by tracking important key metrics and generating actionable insights for you and your team.
How To Access the Analytics Section
- Log in to your Investment Dominator account.
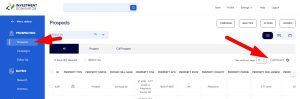
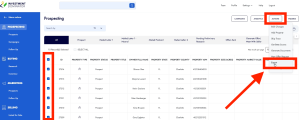
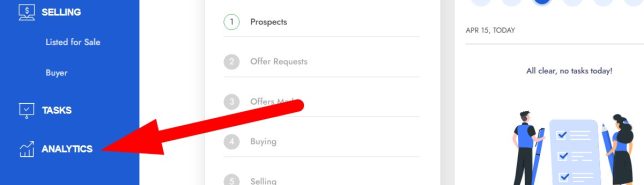
- Navigate to the ‘ANALYTICS‘ tab from the left-side menu:
Available Reports, Analytics, and Key Metrics
- Reports include:
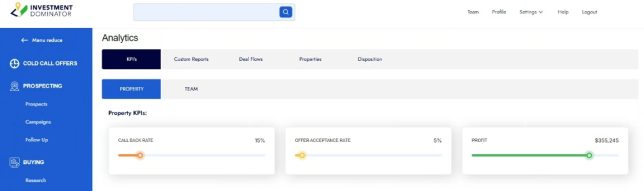
- KPI’s
- PROPERTY
- CALL BACK RATE
This is based off of how many records in your ‘LPG Neutral Letter‘ deal flow move from the ‘Prospect‘ step into to the ‘Offer Request‘ step.
NOTE: This KPI is also shown on your Dashboard. - OFFER ACCEPTANCE RATE
This is based off of how many records in your ‘LPG Neutral Letter‘ deal flow move from the ‘Offers Made‘ step into to the ‘Buying‘ step.
NOTE: This KPI is also shown on your Dashboard. - PROFIT
This is based off what you enter as the ‘Purchase Amount‘ under the ‘Edit Property> Owner> TRANSACTION> PURCHASE‘ section vs. what you enter under the ‘Edit Property> Owner> TRANSACTION> SALE: Sold Amount‘ field.
NOTE: We also factor in the totaled closings costs entered for both the PURCHASE and SALE.
- CALL BACK RATE
- PROPERTY
- KPI’s
- TEAM (These reports can be filter by time period and type)
- Tasks Completed
- Team Tasks
- Custom Reports
- PROPERTY – SEARCH FILTERS – These reports can be created and defined under ‘Settings> Records> SEARCH FILTERS‘
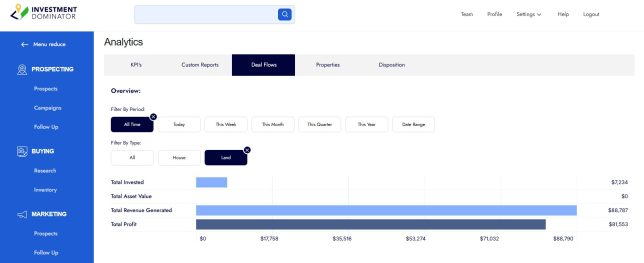
- Deal Flows (These reports can be filter by time period and type)
- Total Invested
- Total Asset Value
- Total Revenue Generated
- Total Profit
- Properties
- BY STAGE – (Stages can be set up under ‘Settings> Records> STAGES‘)
- BY TAG – (Tags can be set up under ‘Settings> Records> TAGS‘)
- BY STATE (These reports can be filter by time period and type)
- Disposition
- INTEREST BY PROPERTY (These reports can be filter by time period and type)
- SELLING ACTIVITY BY STATE (These reports can be filter by time period, type, and status)
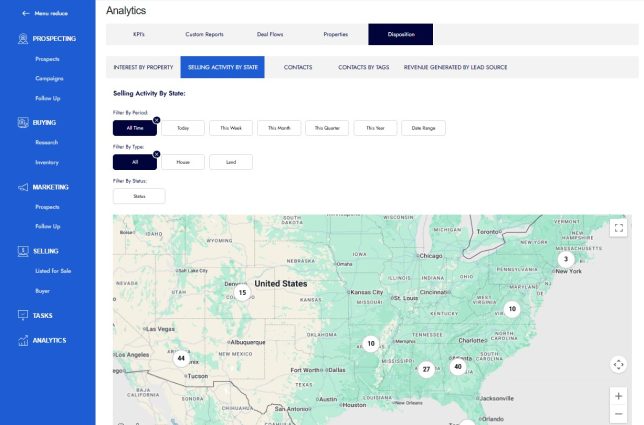
- CONTACTS (These reports can be filter by type)
- CONTACTS BY TAGS (These reports can be filter by time period and tags can be created under ‘Settings> Records> TAGS‘)
- REVENUE GENERATED BY LEAD SOURCE (These reports can be filter by time period and can be created and defined under ‘Settings> Websites> TRACKING‘)
Frequently Asked Questions
What types of reports can I generate in Investment Dominator?
You can generate reports on deal flow, website traffic, lead sources, campaign performance, property views, and more, enabling comprehensive monitoring of your investment marketing efforts.
How do tracking links help with analytics?
Tracking links allow you to identify which marketing activities and platforms are driving traffic and leads, helping you make data-driven decisions to optimize your campaigns. For more information about tracking links click here.
Can I filter reports by date?
Yes, most reports have a ‘Filter by Period‘ option that allows you to filter data by date range.
Is it possible to export analytics data?
Not at this time.
Do analytics replace tools like Google Analytics?
No, Investment Dominator’s analytics focus on CRM and campaign performance, while Google Analytics provides broader website behavior analysis. Both can be used complementarily.